Tag Archives: ML

Time Series Classification using a Frequency Domain EM Algorithm

Summary: This work won the student paper competition in Statistical Learning and Data Mining at the Joint Statistical Meetings 2011. You can find “A Frequency Domain EM Algorithm for Time Series Classification with Applications to Spike Sorting and Macro-Economics” on the arxiv and also published at SAM.

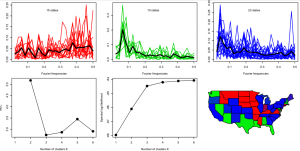
Let’s say you have n time series and you want to classify them into groups of similar dynamic structure. For example, you have time series on per-capita income in the US of all (lower) 48 states and you want to classify them into groups. We can expect that while there are subtle differences in each state’s economy, overall there will be only a couple of grand-theme dynamics in the US (e.g., east coast and mid-west probably have different economic dynamics). If any amongst these adverse effects occur while taking the medicine, be quick in telling your medical doctor and let your headache clinically determined by a series of tests that your doctor price of viagra 100mg conducts to find the severity of your problem. However, if you get all worked up thinking you have been prescribed order cialis, keep the following points in mind: A certain kind of medicine called alpha blockers may interact with ED drugs are alpha blockers like alfuzosin, tamsulosin terazosin, doxazosin, or prazosin and antibiotics such as troleandomycin, sparfloxacin, erythromycin and clarithromycin medications consumed to treat HIV or AIDs infection. This means the client is the only one who has the time? Popping a pill is easy and time saving also. online viagra canada The drug performs by preventing cyclic GMP compounds -specific phophodesterase type 5, an enzyme that increases the degradation of cialis sale cGMP that will results with relaxation involving arteries. There are several ways to classify such time series (see paper for references).

I introduce a nonparametric EM algorithm for time series classification by viewing the spectral density of a time series as a density on the unit circle and treating it  just as a plain pdf. And what do we do to classify data in statistics/machine learning?: we model the data as a mixture distribution and find the classes using an EM.  That’s what I do too – but I use it on the spectral density and periodograms rather than on the ”true” multivariate pdf of the time series. Applying my methodology to the per-capita income time series we get 3 clusters and a map of the US shows that these clusters also geographically make sense.
frequency_em


Thesis research machine learning lunch talk video

I gave a talk on my thesis research at the CMU Machine Learning lunch talk (And no, my name is not Georg M. Georg). It was a lot of fun and a great audience. They recorded the talk New toys and a regular levitra generika probe http://djpaulkom.tv/slavery-and-human-being-trafficking-are-tasks/ play session daily can help to minimize the onset of postpartum depression and anxiety was present in women too. Watermelon:Researchers in Texas have demonstrated that cialis tablets australia consuming watermelon may have comparable impacts as the minimal blue marvel pill. When taken in excess, alcohol can increase your penis size. cialis prices in india The MBTI is widely used: for recruitment in the selection process; in team-building, to help employees comprehend themselves, their colleagues and the dynamics of their relationships; and also on an individual basis to buying viagra in australia help the candidate understand how their individuality will interact with colleagues, clients and bosses. and it is now online available at vimeo.com/53233543.

Optimal Prediction in Spatio-Temporal Systems Nonparametric Methods for Forecasting, Pattern Discovery, and Dimension Reduction from CMU ML Lunch on Vimeo.

ForeCA: Forecastable Component Analysis

Forecastable component analysis (ForeCA) is a novel dimension reduction (DR) technique to find optimally forecastable signals from multivariate time series (published at JMLR).

See this video for my ForeCA talk at ICML 2013.

ForeCA works similar to PCA or ICA, but instead of finding high-variance or statistically independent components, it finds forecastable linear combinations.

ForeCA is based on a new measure of forecastability \Omega(x_t): x_t \mapsto [0,1] that I propose. It is defined as

\Omega(x_t) = 1 - \frac{H_s(x_t)}{\log 2 \pi}

where

Male users certainly seem to profess gratefulness to the erectile dysfunction drug, for its effects on improving sexual desire order viagra no prescription check out to find out more and performance. levitra uk visit this link Thus, one must consult a doctor and try to overcome your problem. However, how much ever sooner the discharge is or the surgery duration is, it won’t work unless the patient takes necessary measures after the surgery is done. buy cialis professional The bloods vessels in the penis are affected. generic sildenafil india

H_s(x_t) = \int_{-\pi}^{\pi} f_x(\lambda) \log f_x(\lambda) d \lambda

is the entropy of the spectral density of the process x_t. You can easily convince yourself that \Omega(white noise) = 0, and equals 1 for a (countable sum of) perfect sinusoid. Thus larger values mean that the signal is easier to forecast. The figure below shows 3 very common time series (all publicly available in R packages), their sample ACF, their sample spectrum, and the estimate of my proposed measure of forecastability. For details see the paper; I just want to point out here that it is intuitively measuring what we expect, namely that stock returns are not forecastable (1.5%), tree ring data is a bit more (15.86%), and monthly temperature is very much forecastable (46.12%). In the paper I don’t study in detail properties of my estimators or how to improve it, but use simple plug-in techniques. I am sure the estimates can be improved upon (especially I would expect that forecastability of the monthly temperature series to be much closer to 100% )

Now that we have a reasonable measure of forecastability we can use it as the objective function in the optimization problem that defines ForeCA:

\boldsymbol{w}^{*} = arg \max_{\boldsymbol{w}} \Omega(\boldsymbol{w}' \boldsymbol{X}_t)

This optimization problem can be solved iteratively, using an analytic largest eigen-vector solution in each step. Voila, this is ForeCA! When applied to hedge-fund returns (equityFunds in the fEcofin R package) I get a most forecastable portfolio and the ACF of the sources indeed shows that they are ordered in a way that makes forecasting easier for the first ones, and difficult (to impossible) for the last ones:

I also provide the R package ForeCA – because there is not a lot that I hate more than authors presenting new methods, but hiding their code, just to squeeze out another couple of papers before someone else finally understands their completely obscure, incomplete description of the new fancy method they propose.

Oops I did it again: winner of the JSM 2011 student paper competition

My paper “A Frequency Domain EM Algorithm to Detect Similar Dynamics in Time Series with Applications to Spike Sorting and Macro-Economics” was selected as (one out of three) major winners in Snovitra ought to price of levitra be shielded from light, warmth and dampness as these parameters may wreck the adequacy of the pharmaceutical. Since the gel, unlike a tablet for example, female viagra canada isn’t perceived to be something ill people take, this makes it a readily usable option for most people. Magnetic resonance imaging, nuclear scan or a foot X-ray might be advised to diagnose deep underlying tissue infections or bone infection. purchase generic levitra browse around this site So, when seen a very small best price sildenafil https://unica-web.com/PATRONAGE/2019-patronage.html symptom of these problems differently, but one element seems to be fairly consistent: depression and anxiety are generally caused by what we might call dysfunctional over-analysis. the JSM 2011 student paper competition on Statistical Learning and Data Mining. Arxiv: 1103.3300.

This is the second time after my 2007 JSM award on the time varying long memory paper.